THE SIGNAL IN ONE SENTENCE
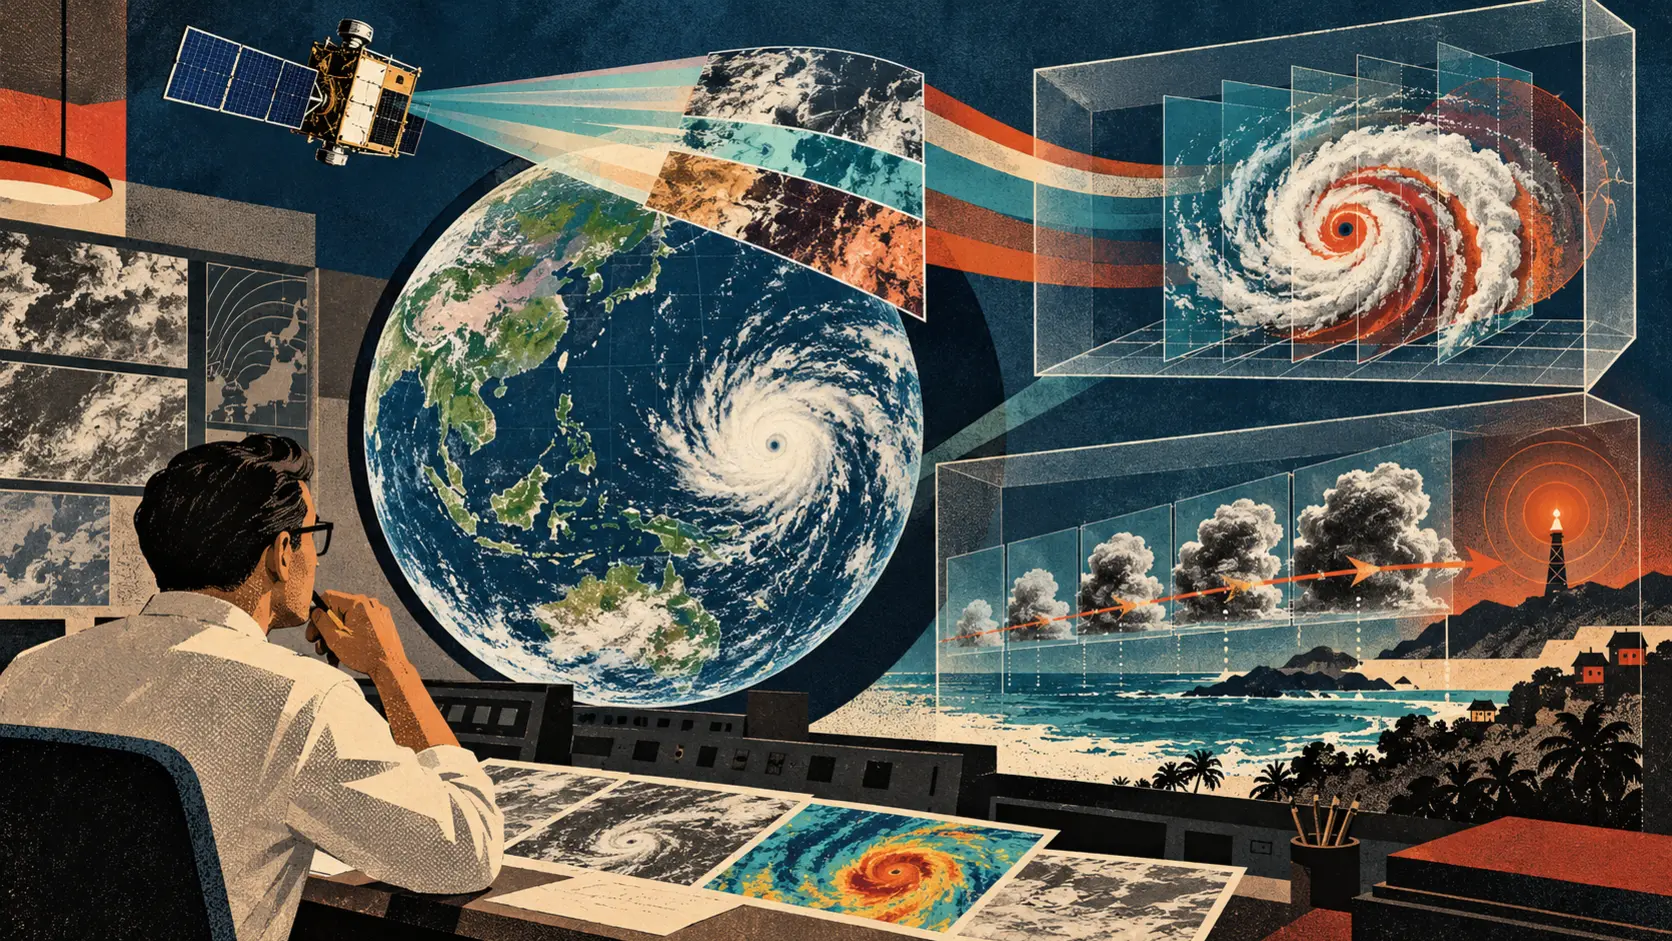
Weather AI has a particularly rude customer: the atmosphere. It does not care how elegant the model looked in a demonstration. It does not pause while a team fixes a dashboard. It can change faster than an official warning can travel from a satellite, through a forecast office and into somebody's phone. China released its first batch of Fengyun meteorological satellite models for extreme weather on October 29, with the public announcement following on October 30. One model interprets typhoon cloud imagery. The other uses recent Fengyun-4 observations to project cloud development and identify areas where severe convection may form. The announcement says the typhoon model analyzes seven kinds of storm features every 15 minutes and can generate an interpretation in 27 seconds. It is designed to describe a storm's position, structure, intensity and evolution while producing visual material for forecasters. The severe-convection model takes two hours of continuous satellite observations and projects what may happen next. The China Meteorological Administration says it can extend warning lead time to four hours. Those are useful capabilities if they hold up in daily forecasting. The plain signal is not that a satellite has become a meteorologist. It is that forecasters may get a faster first pass over an enormous stream of imagery, and communities may gain more time before dangerous winds, hail, intense rain or flash flooding. That extra time is valuable only if the warning remains tied to evidence. For every model-generated interpretation, keep a verification trail that connects the input images, observation times, satellite and instrument, model version, forecast area, confidence, forecaster edits, issued warning and eventual weather outcome. Call it the sky trail. The name is a little playful. The need is not. Weather forecasts already combine instruments, numerical models, local knowledge and professional judgment. Adding an AI system can speed the loop, but it also adds another place where uncertainty can be hidden behind a smooth picture or confident paragraph. The typhoon model is easier to understand when separated into two jobs. First, it observes patterns in satellite products. A tropical cyclone can be described through features such as the eye, cloud bands, central dense overcast, thermal structure and surrounding convection. The public reporting says the Fengyun model integrates more than 20 kinds of real-time satellite products and produces a visual basis for its interpretation. Second, it turns those patterns into a standardized account that a forecaster can inspect. That standardization can reduce repetitive work. A person watching several storms does not have to begin every analysis with a blank page. The model can assemble a first description and point to relevant imagery. It can also create false neatness. A standardized report may make an uncertain storm look settled. Two storms can share a visual feature while behaving differently because of ocean heat, wind shear, surrounding moisture or interactions that the summarized view does not capture. A model may identify a structure correctly but overstate what it implies for intensity. The sky trail should therefore preserve the underlying images beside the generated statement. If the system says a storm is strengthening, the forecaster should be able to open the observation sequence, see which products support the claim, identify missing or degraded inputs and record whether the conclusion was accepted, edited or rejected. Do not save only the final paragraph. The severe-convection model has a different challenge. Convective storms are small, fast and locally destructive. A broad cloud pattern may develop into damaging weather in one place and harmless rain in another. Satellite observations provide wide coverage, but the most useful warning often depends on joining them with radar, surface stations, lightning data, terrain, numerical forecasts and reports from the ground. The public announcement describes a model based on two hours of Fengyun-4 observations. It does not publish a complete operational evaluation showing performance by region, season, storm type and lead time. That gap matters because a four-hour horizon is not one score. Measure the model at 30 minutes, one hour, two hours, three hours and four hours. Show probability of detection, false alarms, missed events, location error, timing error and severity error. Break the results down by geography and weather regime. Report how performance changes when observations are incomplete. A useful model may be excellent at the first hour and increasingly vague after that. It may catch large storm systems while missing compact ones. It may perform differently near mountains, coastlines or sparse observation networks. One average can hide all of that. Warning systems also have human costs. A false alarm can interrupt travel, schools, work and emergency services. Repeated false alarms can teach people to ignore the next message. A missed warning can leave communities with no time to shelter. A correct warning can still fail if it arrives in language people do not understand, through a channel they cannot access or without a practical action. The model's score is only the beginning of the public-service measurement. For each warning, record who received it, when it reached them, whether the message changed behavior and what happened next. Protect personal information, but measure the delivery chain. The extra forecast hour is not useful if it disappears inside approval, translation or distribution. China's Fengyun system has an international dimension. The official announcement says 10 Fengyun meteorological satellites are in orbit and that their data is open to 141 countries and regions. That reach creates an opportunity. Countries with limited radar coverage can use geostationary satellite observations as an important part of storm monitoring. A shared AI product could help local forecast offices triage large areas, especially where staffing and computing are constrained. It also creates a responsibility not to export one opaque score as if it travels perfectly. Local agencies need evaluation on their own weather, terrain, languages, communication systems and warning thresholds. They need stable access to observations and documentation. They need a way to report failures, compare the AI output with local instruments and keep operating when a service or network connection is unavailable. The model should travel with an evidence package, not merely an endpoint. That package should name the training and evaluation periods at a useful level, the geographic coverage, input products, known blind spots, update history, versioning policy, latency, computing requirements and licensing or access terms. It should include reference evaluations that local meteorological services can reproduce. For operational use, the sky trail begins before inference. Record the satellite, instrument, scan time and data-product version. Record missing tiles, calibration issues, delays and quality flags. Keep a hash or other stable identifier for the exact input set. Then record the model. Save its name, version, configuration, serving environment, code or image digest where available and the time the run started and ended. If the model changes, start a new evaluation series. Do not silently pool results from two versions because the dashboard kept the same friendly label. Next comes the prediction. Store the geographic footprint, valid time, lead time, predicted phenomenon, confidence and threshold that triggered attention. Keep the generated text and visual products. Link every conclusion to the observation layers used to support it. Then record the human decision. Who reviewed the output? Which parts were accepted? What was changed? Which other evidence was consulted? Was a warning issued, delayed or withheld? If the model and forecaster disagreed, preserve the disagreement instead of editing history until the system appears calm and wise. Finally, attach the outcome. When observations arrive, compare them with the prediction. Record hits, false alarms, misses, timing and location differences. Include the warning delivery timeline and any confirmed consequences. Feed the result into evaluation and training only through a documented process that prevents one bad label or one unusual storm from becoming invisible folklore. This is not busywork. The trail supports several practical jobs. A forecaster can review why an alert appeared and decide whether local evidence confirms it. A supervisor can see when a model version began drifting. A scientist can compare performance across seasons. An emergency manager can examine whether more lead time improved decisions. An international partner can test the product on local storms. A public auditor can ask whether warnings were issued consistently without receiving sensitive operational details. The trail also makes corrections possible. Suppose the typhoon model produces a confident interpretation from a delayed or partially corrupted observation sequence. Without input identifiers and quality flags, the failure may look like a mysterious reasoning error. With the trail, the team can see that the model was asked to describe a sky it did not fully receive. Or suppose the severe-convection model flags a large area four hours ahead, a forecaster narrows it using radar and the damaging storm lands inside the edited area. The outcome should not be credited entirely to the model or entirely to the person. The record should show the collaboration. That distinction helps improve the system without turning evaluation into a political contest between automation and expertise. There are sensible product features that follow from this approach. Show observation age prominently. A beautiful satellite image can be old. Display confidence as a range and pair it with the historical performance of similar predictions. Do not replace uncertainty with a red icon. Let forecasters compare the AI output with baseline numerical guidance and recent manual analysis. Make every generated sentence clickable back to supporting imagery. Mark data gaps before showing the interpretation. Provide a simple way to reject or edit the model's conclusion and capture a reason without forcing a person through a small bureaucratic opera during an active storm. Keep a replay view that reconstructs what the office knew at each moment. Post-event analysis should not accidentally use observations that arrived after the warning decision. Publish a public scorecard after enough operational use. The scorecard should include detection, misses, false alarms and timeliness. It should distinguish model output from final warnings and separate research evaluation from live operation. It should report degraded-data performance and regional variation. It should include examples where the model failed. Failure examples are not a confession that the project is useless. They are evidence that the institution understands weather. The public record available at release leaves important questions unanswered. The announcements do not provide the model architectures, full training datasets, complete evaluation protocol, independent comparison, operational thresholds or performance tables. They do not establish that a four-hour warning is equally accurate across all regions or storms. They do not show how much time remains after forecaster review and public distribution. The typhoon interpretation time of 27 seconds describes generation speed, not forecast accuracy. The statement that data is open to 141 countries and regions does not mean every country has equal bandwidth, compute, training or operational support. The fact that an output is based on satellite observations does not make every conclusion correct. Evidence can be real while interpretation is wrong. These are normal reasons for careful deployment, not reasons to throw away the idea. Satellite imagery is a good place for machine assistance because the data is frequent, visual and too large for any person to inspect exhaustively. Extreme-weather warning is a good place for caution because consequences arrive outside the screen. Start with shadow operation where the model runs beside existing processes and its predictions are scored without changing public warnings. Move to advisory use where forecasters inspect the output but remain responsible for decisions. Expand only after region-specific performance, failure recovery and warning delivery are measured. Rehearse degraded conditions. Delay an observation. Remove one product. Interrupt network access. Feed the system an unusual storm structure. Test whether the interface communicates uncertainty or simply keeps drawing. Confirm that forecasters can fall back to established methods. Then rehearse accountability. Pick one past warning and reconstruct it from the sky trail. Can an independent reviewer identify the inputs, model, forecast, edits, warning, delivery and outcome? Can the office explain why it acted when it did? Can it distinguish a model miss from a data outage or a distribution delay? If the answer is yes, the AI has joined a professional forecasting system. If the answer is a screenshot and a confident sentence, the satellite may be watching the storm more carefully than the institution is watching the model.
01
WHAT ACTUALLY CHANGED
China released its first batch of Fengyun satellite AI models for extreme weather at a user conference in Changsha on October 29, 2026.
One model interprets typhoon cloud imagery and produces standardized text and visual products for forecasters.
The typhoon model is reported to cover seven feature types, analyze imagery every 15 minutes and generate an interpretation in 27 seconds.
A second model uses two hours of continuous Fengyun-4 observations to project cloud evolution and identify potential severe convection.
The China Meteorological Administration says the severe-convection model can extend warning lead time to four hours.
The official announcement says China has 10 Fengyun meteorological satellites in orbit and makes their data available to 141 countries and regions.
02
WHY THIS MATTERS
Faster interpretation of frequent satellite observations could give forecasters more time to examine dangerous storms and warn communities.
Satellite products can be especially valuable where radar, surface instruments, staffing or computing are limited.
A generated description can hide uncertainty unless every conclusion remains linked to its observation sequence and quality flags.
A four-hour warning claim needs evaluation at several lead times and across regions, seasons and storm types rather than one average score.
Public value depends on the full delivery chain from prediction to forecaster review, message distribution and protective action.
International use requires local validation, documentation, fallback procedures and access to reproducible evidence.
03
WHERE IT COULD HELP
- Create a sky trail linking each output to satellite, instrument, observation time, product version and data-quality flags.
- Record the exact model version, configuration, runtime, geographic footprint, lead time, threshold and confidence for every prediction.
- Make generated statements clickable back to the imagery and products that support them.
- Preserve forecaster acceptance, edits, rejections, other evidence consulted and the final warning decision.
- Attach observed weather, detection result, location and timing error, delivery timeline and confirmed response after the event.
- Run the models in shadow mode before advisory or warning use, and publish region-specific scorecards with misses and false alarms.
- Test delayed, missing and degraded observations plus network failure, unusual storms and manual fallback.
KEEP A HAND ON THE WHEEL
The release materials do not publish complete model architecture, training data, evaluation tables, operating thresholds or independent validation. Generation in 27 seconds measures speed, not correctness. A four-hour horizon may perform differently by lead time, geography and storm type. Watch for technical papers, live operational evaluations, false-alarm and miss rates, degraded-data tests, local validation outside China, documentation for international users, model update logs and evidence that added forecast time survives review and public delivery.
04
TERMS WORTH KEEPING
SOURCES AND VERIFICATION STATUS
This article was written from the materials below. Product claims and dates were checked against those sources on November 1, 2026.
THE PUBLICATION ENGINE
WANT A SIGNAL OF YOUR OWN?
We build source-grounded publications, private briefings, and editorial systems for organizations with something useful to say.
WORK WITH US