THE SIGNAL IN ONE SENTENCE
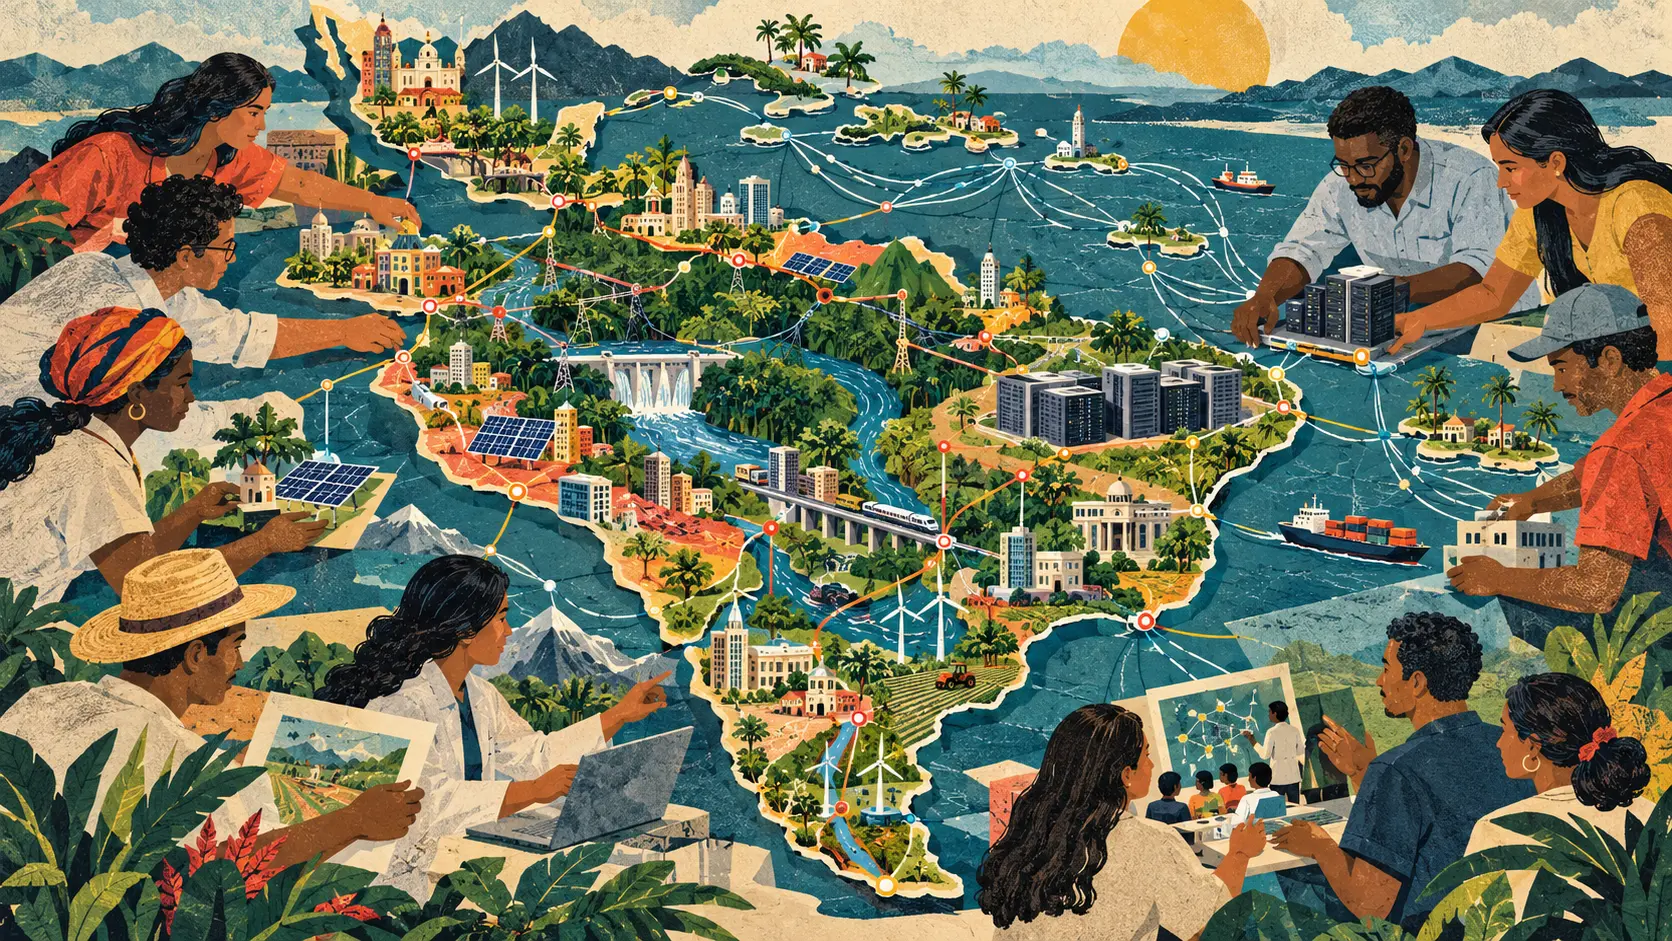
Latin America and the Caribbean have another AI ranking. The useful next move is to stop treating it like a beauty contest. On October 20, Chile's National Center for Artificial Intelligence, CENIA, and the United Nations Economic Commission for Latin America and the Caribbean, ECLAC, presented the fourth edition of the Latin American Artificial Intelligence Index, known as ILIA. The 2026 index measures AI readiness, development and governance across 20 countries. Trinidad and Tobago joins the study for the first time. The framework now contains three dimensions, 10 subdimensions, 29 indicators and 126 subindicators. That is a lot of measuring tape. The headline ranking puts Chile first with 71.4 points, followed by Brazil with 68.4 and Uruguay with 67.0. ILIA calls those three countries pioneers because each scores above 60. A larger group sits in the adopter category, and seven countries remain in the explorer category. Rankings are irresistible. They fit neatly into headlines, ministerial speeches and slides with arrows pointing up. They can also flatten the most important finding in the report. The region's useful capabilities are spread unevenly across borders. The highest-ranked country does not own every ingredient. The lower-ranked countries are not empty spaces. Compute, clean energy, research, data services, schools, public institutions, software communities and specialized talent do not line up in one national stack. That is why ILIA's central message is that the AI contest is played as a team. The verified numbers make the case. Brazil holds 87.7 percent of the GPUs identified by the index and 92 percent of the region's processing capacity. The five comparison countries outside the region, Germany, Spain, Estonia, Portugal and Singapore, average about 29 times more GPUs per million people than Latin America and the Caribbean. The gap is not only about machines. Sixty-five percent of the 20 countries have at least one specialized AI research center. Eleven include AI content in school curricula, compared with two in 2024. All 20 have AI-related master's programs, and 14 have doctoral programs. The region also has energy and infrastructure assets. Paraguay, Costa Rica, Uruguay, Venezuela, Brazil and Colombia have a higher clean-energy share than Portugal, the strongest renewable-energy performer among the five external comparison countries. ILIA reports 0.92 certified data centers per million people across the region, compared with 0.73 in the external group. Then the weaknesses reappear. AI adoption reaches 27.6 percent of large companies in the region, 12.8 percent of medium-sized companies and 6.8 percent of small companies. Eighty-five percent of the countries have a national AI strategy in force or under development, and 75 percent have an institution responsible for leading it. But among the 12 countries with an adopted strategy, only Brazil and Colombia specify a budget to execute it. This is the verified picture: more scientific, educational and institutional capacity, but concentrated compute, uneven adoption and a wide gap between strategy and funded implementation. The Plain Signal argument starts with a change of format. Keep the ranking. Add a shared capacity map. A ranking asks who is ahead. A capacity map asks what exists, who can use it, what is missing and which connection would unlock the next useful project. The map should begin with compute. Do not place a single dot over Brazil and call the problem described. Record the type of infrastructure, usable capacity, ownership, price, energy source, network access, residency conditions, eligible users and reservation process. Then record the access gap. Can a university in Honduras run a regional language model evaluation there? Can a public-health team in the Caribbean reserve capacity during an emergency? Can a small company in Ecuador pay in local currency? Can researchers move a sensitive dataset without violating national law? Capacity that exists but cannot be accessed is a landmark, not a shared resource. The second layer should be energy. The renewable-energy numbers are not permission to drop data centers wherever a clean grid appears on a chart. Water, transmission, local demand, climate resilience, land use and community consent still matter. But the regional mix creates options. Countries with abundant clean power could host carefully chosen computing infrastructure. Countries with stronger data services or research communities could contribute operating expertise, public-interest workloads and evaluation. The point is not to move every server to the sunniest flag on the map. It is to plan infrastructure as a regional system instead of twenty isolated shopping lists. The third layer should be data that can legally travel. ILIA says the region's problem is not only whether data exists. Legal uncertainty around text and data mining can limit the construction of corpora and the training of local models even when useful material is technically available. A capacity map should therefore show licenses, access conditions, privacy restrictions, language coverage, provenance and the public body responsible for each important dataset. Spanish cannot be the default label pasted over hundreds of local varieties, and Portuguese cannot be treated as the only other language that matters. The Caribbean adds English, French, Dutch, Haitian Creole and many more language communities. Indigenous languages bring different rights, institutions and expectations about collection and reuse. Shared data capacity needs governance before it needs a download button. The fourth layer should be people. Counting degree programs is useful. It does not show whether students can finish them, whether researchers stay in the region, whether public agencies can hire them or whether a small company can afford their work. Map programs alongside scholarships, faculty, research centers, computing access, employer demand and migration. Connect a school curriculum to the teacher training that makes it real. Connect a master's program to projects that serve local industries and public services. Connect a research center to stable funding rather than another twelve-month scramble. The fifth layer should be adoption support for smaller organizations. The company numbers show a steep size gradient. Large firms adopt AI more often than medium-sized firms, and medium-sized firms adopt it more often than small ones. That does not mean every small business needs an agent. It means the region should distinguish a useful adoption barrier from a sales pitch. Some companies need better accounting software before they need a model. Some need clean records, reliable broadband, cybersecurity, worker training or a shared technical service. A capacity map should connect the actual bottleneck to the appropriate support, then measure whether the business saved time, improved quality or reached new customers. The sixth layer should be public strategy with money attached. An AI strategy without a budget can still coordinate policy. It cannot buy infrastructure, fund researchers, train teachers, modernize procurement or maintain public systems by the force of vocabulary alone. For every national commitment, publish the responsible institution, budget line, delivery date, beneficiary, procurement route and outcome measure. If the budget is missing, say missing. If the funding is spread across ministries, show the pieces. This turns the map into an accountability tool. The seventh layer should record the terms of cooperation. Regional sharing sounds friendly until a queue forms. Who receives priority when capacity is scarce? What does access cost? Where is data processed? Who owns a jointly trained model? Which country handles an incident? Can a smaller state leave the arrangement and take its data, code or trained staff with it? Write those rules before the ribbon cutting. A shared resource should have a public service description: what it offers, who qualifies, how decisions are made, how disputes work, what performance is measured and when the arrangement will be reviewed. The eighth layer should show human outcomes. ILIA is an ecosystem index. It does not prove that a higher score made a hospital faster, a school fairer, a farmer more resilient or a worker more secure. That is not a defect. It is a boundary. Composite indicators summarize complicated systems. They help reveal patterns and gaps. They do not replace project evaluation, public consultation or the experience of people living with the result. Every regional project should therefore connect capacity to a named public or economic outcome. A compute program could report research access by country and institution. A language-data initiative could report coverage, consent and downstream services. A small-business program could report survival, productivity and worker impact rather than license activations. The ninth layer should preserve disagreement. Countries will not share one definition of AI sovereignty, one regulatory approach or one development priority. That difference can be useful. A capacity map should support multiple routes, not pretend that the ranking reveals a single ladder everyone must climb. It should also show uncertainty. An indicator based on incomplete or older data deserves a visible date and limitation. A score changed by a methodology update should not be presented as pure national progress or decline. The tenth layer should be a project ledger. For every proposed cross-border effort, name the capability being shared, participating institutions, funding, access rules, milestone, public result and renewal decision. Start small enough to verify. Reserve compute for a multi-country health-language benchmark. Create a scholarship exchange between a research center and two public universities. Build a legally reviewed corpus for a neglected language. Let small manufacturers share an independent AI testing service. Connect a renewable-energy site to a defined set of public-interest computing workloads. Then publish what happened. The ranking will return next year. Scores will move. Somebody will celebrate. Somebody will announce a task force. The more interesting question is whether the region can point to new connections that did not exist before. Which students gained access? Which datasets became usable under clear rules? Which public agencies shared a tool? Which smaller companies crossed a real barrier? Which infrastructure served more than the country that hosts it? That is how a scoreboard becomes a map. And a map, unlike a podium, can tell everyone where to go next.
01
WHAT ACTUALLY CHANGED
CENIA and ECLAC presented the fourth edition of ILIA on October 20, 2026
The index measures AI readiness, development and governance across 20 Latin American and Caribbean countries
Trinidad and Tobago entered the index for the first time
The 2026 framework contains three dimensions, 10 subdimensions, 29 indicators and 126 subindicators
Chile leads the overall ranking with 71.4 points, followed by Brazil with 68.4 and Uruguay with 67.0
Brazil holds 87.7 percent of identified regional GPUs and 92 percent of processing capacity
The five external comparison countries average about 29 times more GPUs per million people than the region
Eleven of 20 countries now include AI content in school curricula, up from two in 2024
All 20 countries have AI-related master's programs and 14 have doctoral programs
Only Brazil and Colombia specify an implementation budget among the 12 countries with an adopted national AI strategy
02
WHY THIS MATTERS
A single national ranking can hide capabilities that are distributed across the region
Concentrated compute creates an access problem even when aggregate regional capacity rises
Clean energy, certified data centers and research centers provide building blocks for regional infrastructure
Legal uncertainty can prevent technically available data from becoming usable training or evaluation material
Education counts do not reveal whether students, researchers and public institutions can sustain their work
Small-company adoption gaps may reflect missing foundations rather than a lack of enthusiasm for AI
National strategies need named budgets and delivery owners to move from planning into implementation
Shared infrastructure requires clear access, pricing, governance, incident and exit rules
Composite index scores describe ecosystems but do not prove public benefit or product quality
A project ledger can turn regional cooperation from a slogan into measurable work
03
WHERE IT COULD HELP
- Publish a regional inventory of compute capacity with ownership, price, energy source and access rules
- Reserve shared compute for verified public-interest, research and small-country workloads
- Map renewable energy alongside water, transmission, resilience and community constraints
- Create a multilingual data registry with provenance, licenses, consent and legal-use conditions
- Fund language resources for Caribbean and Indigenous communities under community-defined governance
- Connect school AI curricula to teacher training, classroom infrastructure and evaluation
- Link graduate programs to stable research funding, compute access and regional exchange
- Diagnose the actual technology barrier faced by smaller companies before subsidizing AI products
- Attach every national AI commitment to a budget, institution, deadline and outcome measure
- Define cross-border access, ownership, incident response, dispute and exit rules in advance
- Measure human outcomes separately from ecosystem readiness scores
- Maintain a public ledger for regional projects, milestones, beneficiaries, evidence and renewal decisions
KEEP A HAND ON THE WHEEL
Watch whether CENIA and ECLAC publish the complete 2026 methodology and downloadable country data; how governments respond to the rankings; whether compute-sharing proposals name access and governance rules; whether Brazil's concentrated capacity serves regional research; which countries attach budgets to AI strategies; how Trinidad and Tobago uses its first country profile; whether curricula changes include teacher support; whether language-data initiatives include Caribbean and Indigenous governance; whether small-business programs measure business and worker outcomes; and whether the next ILIA edition can point to completed regional projects rather than cooperation promises alone.
04
TERMS WORTH KEEPING
OPEN GLOSSARY CARD
Text and data mining
Automated analysis of large collections of material to identify patterns, relationships, or information.
OPEN GLOSSARY CARD
Data governance
The rules, roles and records that determine how data is collected, accessed, used, shared, retained and deleted.
OPEN GLOSSARY CARD
Compute capacity
The amount of processing work that computers and data centres can perform within limits such as time, power, memory, cooling, and network access.
SOURCES AND VERIFICATION STATUS
This article was written from the materials below. Product claims and dates were checked against those sources on October 21, 2026.
THE PUBLICATION ENGINE
WANT A SIGNAL OF YOUR OWN?
We build source-grounded publications, private briefings, and editorial systems for organizations with something useful to say.
WORK WITH US