THE SIGNAL IN ONE SENTENCE
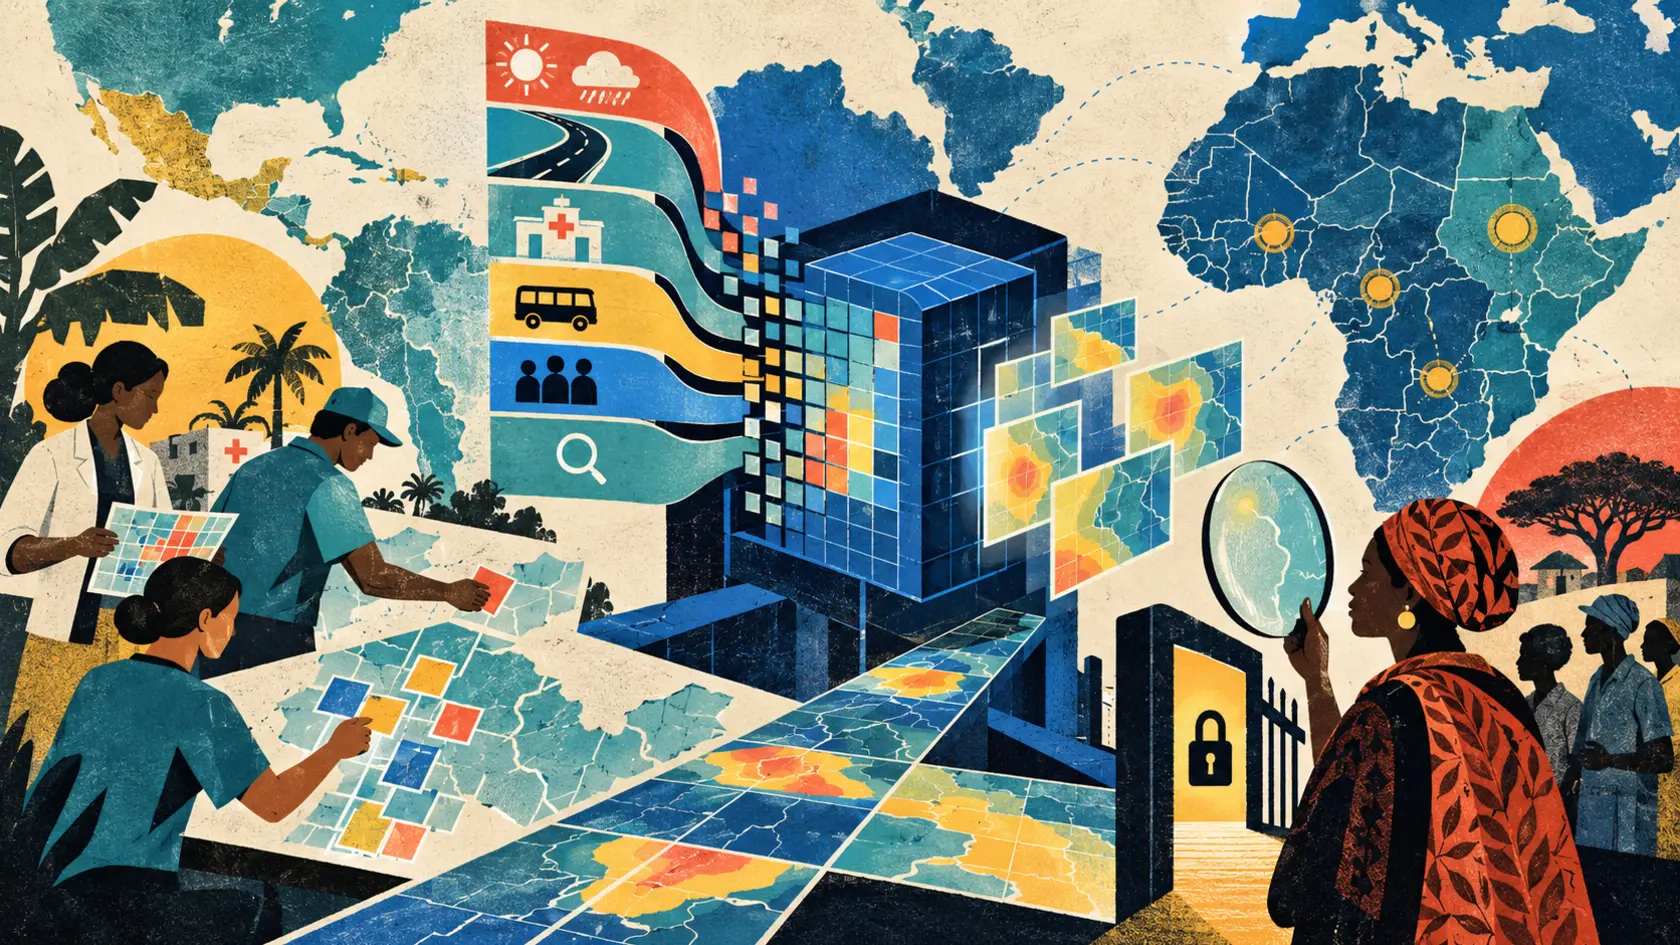
A map can show where people live. Google wants its newest kind of map to show how a place behaves. The company's Population Dynamics Foundation Model, usually shortened to PDFM, turns signals about aggregated search interest, mobility, the built environment, weather and air quality into compact numerical representations of locations. Google calls these location embeddings. Think of each one as a machine-readable fingerprint for a place, refreshed on a monthly schedule. Public-health researchers can add those fingerprints to models they already use instead of assembling every underlying data stream from scratch. That is the pitch. The evidence is now more interesting than the pitch. Google Research and 37 collaborators published a paper covering five partner-led case studies across the United States, Canada, Mexico and the Democratic Republic of the Congo. The studies examined vaccination coverage, cardiovascular mortality, dengue forecasting, postpartum-depression screening and cholera emergence. In several cases, PDFM improved a forecast or matched slower conventional data. In others, the gain was small, concentrated in particular places or absent at the time horizon that mattered. That unevenness makes the work useful. It suggests location embeddings may become a practical extra input for public-health teams. It does not support the much louder claim that one planetary model has solved disease surveillance. Start at the United States and Canada border. Researchers examined 146 US counties within 150 kilometers of Canada. Adding Canadian context to a US model increased explained variation in local measles, mumps and rubella vaccination coverage from 0.159 to 0.216. That is a 36 percent relative increase. For counties holding about 4.7 million people, the added context shifted estimated coverage by at least three percentage points. The idea is sensible. People, media, shopping patterns and family ties cross borders even when government datasets stop at them. A model that notices those shared patterns can sometimes see what a domestic-only spreadsheet misses. But Canadian embeddings alone performed poorly across the full United States. Context helped when it complemented domestic information. It did not replace it. The cardiovascular study tells a similar story. Official county-level mortality data can lag by one or two years. Researchers tested whether one month of PDFM signals could stand in for American Community Survey inputs that pool five years of observations and can arrive up to a year after collection. For nowcasting 2023 county-level cardiovascular deaths, models using PDFM had a mean absolute error of 18.7 deaths per county, compared with 19.1 for models using the census-based inputs. The reported root mean squared errors were 46.0 and 57.69. Those differences were not statistically significant. That sentence matters more than the prettier number. PDFM did not prove itself better than census data in that comparison. It performed about as well while using a fresher signal. For health departments waiting on old data, parity can still be valuable. A current estimate that is no worse than a stale one can change when people plan outreach or prevention. Mexico's dengue results show why averages can be slippery little creatures. Across roughly 2,450 municipalities, adding PDFM produced a statistically significant improvement for one-month forecasts. The benefit was concentrated where dengue was actively circulating. Depending on the level of active transmission, about 65 to 72 percent of municipalities benefited. Across all municipalities, however, only 47.6 percent improved on average. The median municipality did slightly worse. Larger gains in some places outweighed smaller declines elsewhere. At three months, the model improved forecasts in some active-transmission areas but became more likely to overpredict in quiet places. At six months, static location features could not capture future weather and mosquito conditions that had not happened yet. So the model appears most useful as a short-range correction during active outbreaks, not as a magic dengue crystal ball. The cholera study in the Democratic Republic of the Congo found another narrow window. Researchers used surveillance records across 403 health zones and asked whether a lighter version of PDFM could identify places where cholera would emerge. One or two weeks ahead, recent case counts already carried most of the useful signal, and PDFM did not significantly improve accuracy. Four to eight weeks ahead, the embeddings helped more. At eight weeks, the average number of correct zones among each week's five highest-risk predictions rose from 1.78 to 2.10. The biggest gains appeared in 15 zones where cholera was already endemic. That is not a perfect early-warning system. Three of the five weekly picks were still wrong on average. But when clean water, vaccines and treatment supplies need time to move, even a modestly better shortlist could be operationally useful. Could be is doing important work there. The studies evaluated predictions. They did not run a randomized public-health deployment showing that officials acted on the rankings, moved resources effectively and prevented infections or deaths. A better score is evidence about a model. It is not yet evidence about a health outcome. The postpartum-depression study marks an even clearer boundary. Researchers evaluated records from 332,970 respondents in the US Pregnancy Risk Assessment Monitoring System. Adding place-level embeddings produced a small but statistically significant gain in risk prediction. The reported increase in area under the curve was 0.0020 in states represented during training and 0.0038 in states held out from training. The embeddings did not replace a person's income and insurance information. They recovered about 15 percent of that individual-level predictive signal when those details were unavailable. They also did not close the study's largest demographic screening gap. Under a target designed to catch 80 percent of cases, fewer than half of Asian mothers with symptoms were identified, with or without PDFM. Place can add context. Place is not a person. That distinction should travel with every use of these embeddings. A neighborhood fingerprint can reflect poverty, transit access, environmental exposure, clinic density and collective behavior. It can also flatten the differences among people who share a postal area. If a health system treats a place score as an individual diagnosis, it has changed the tool and the ethical stakes. Now we reach the data bargain. Google describes PDFM's inputs as privacy-preserving. The model uses aggregated search trends, mobility and place activity, built-environment information, weather and air quality. Researchers receive numerical representations rather than raw search histories or individual movement records. Aggregation is useful protection. It is not the same thing as public governance. Communities whose behavior contributes to a location fingerprint may not know the representation exists, which inferences it supports or which institutions can purchase access. Public-health teams using the output may be unable to inspect the underlying signals closely enough to explain why a particular place received a higher risk estimate. That creates a strange arrangement. The public supplies the patterns. Google controls the representation. Researchers add health labels. Governments may eventually use the forecast to decide where attention and resources go. Every step can be defensible. The chain still needs daylight. At minimum, an operational deployment should publish a data card for each use. It should list the countries covered, update schedule, spatial resolution, input categories, excluded populations, validation period, missing-data behavior, known geographic weaknesses and the decision the model is allowed to influence. It should also state what the embedding cannot reveal. No official should be able to look at a risk score and casually tell a story about why a community behaves a certain way. Embeddings are compressed correlations. They do not explain causes. A dengue signal might reflect climate, travel, care-seeking behavior, reporting differences, internet access or several things tangled together. The access model deserves equal scrutiny. Google says PDFM embeddings are available in 17 countries. The commercial version is in preview through Google Maps Platform. Academics and public-health researchers can request no-cost access for selected, non-operational research uses. That split can accelerate experiments while leaving the organizations closest to an outbreak dependent on approval, commercial terms or technical infrastructure they do not control. A public-health foundation layer should not become a tollbooth at the exact moment a ministry needs to act. Governments and nonprofit partners should negotiate durable access, export rights, version pinning, change notices and an exit path before building an essential workflow around it. They should be able to preserve the embedding version used for a decision, reproduce the analysis later and compare it with non-Google alternatives. Independent validation also needs to move beyond collaborator-led studies. The paper includes partners from universities, hospitals and the World Health Organization Regional Office for Africa. That breadth is a strength. Google researchers remain central authors, and the evaluated system is Google's product. The next evidence should come from teams that can test the embeddings without a shared launch incentive. They should try new countries, new diseases, rural and under-connected regions, distribution shifts, degraded data periods and decision settings where a false alarm carries a real cost. They should publish the failures too. There are worthwhile applications right now. Border health teams can test whether cross-border context improves vaccination estimates. Cities can compare fresh location signals with delayed census indicators. Outbreak teams can use the embeddings as one feature in short-horizon dengue or cholera triage. Maternal-health researchers can measure whether geographic context adds anything after individual information is available. The common rule is simple. Use the embedding as a witness, not the judge. Keep the conventional data. Show the uncertainty. Measure whether decisions improve. Audit who benefits and who gets missed. Give communities and public institutions a clear account of the data bargain. Google has produced a fresh map. Before public health starts steering by it, everyone deserves to know who drew the contours, who can see behind them and what happens when the map is wrong.
01
WHAT ACTUALLY CHANGED
Google Research and collaborators published five public-health evaluations of Population Dynamics Foundation Model location embeddings across four countries
The embeddings compress aggregated search, mobility, built-environment, weather and air-quality signals into monthly place representations
Cross-border context improved MMR vaccination estimates in 146 US border counties, while fresh PDFM inputs performed comparably to older census inputs for cardiovascular nowcasting
Short-horizon dengue and cholera gains were concentrated in active or endemic locations and weakened at other horizons
Commercial preview access is available through Google Maps Platform, while selected researchers can request no-cost access for non-operational work
02
WHY THIS MATTERS
Public-health agencies may gain fresher local signals without rebuilding every search, mobility and environmental data pipeline
Performance varies by disease, location and forecast horizon, so average gains can hide communities where predictions get worse
Place-level representations can supplement individual information but should not be treated as diagnoses or causal explanations
A proprietary geospatial layer could become critical public-health infrastructure without equivalent public control or reproducibility
Predictive improvement does not prove that real deployments improve resource allocation or health outcomes
03
WHERE IT COULD HELP
- Test cross-border vaccination coverage estimates against domestic-only models and official local records
- Use fresh place embeddings as one covariate when chronic-disease data arrives years late
- Support short-horizon outbreak triage while keeping clinical surveillance, weather data and human review in the decision loop
- Build public deployment cards recording geography, model version, uncertainty, failure patterns, allowed decisions and appeal routes
- Require independent validation, export rights, version pinning and an exit plan before using commercial embeddings as essential infrastructure
KEEP A HAND ON THE WHEEL
Watch for independent replications outside the launch collaborators, evaluations in additional countries and under-connected regions, operational trials measuring health outcomes rather than model scores, details about aggregation and privacy safeguards, pricing and licensing for public agencies, version histories, change notices, export and reproducibility rights, subgroup error reporting, false-alarm costs, and evidence that local institutions can govern how the embeddings influence resource decisions.
04
TERMS WORTH KEEPING
OPEN GLOSSARY CARD
Location embedding
A numerical representation that compresses several signals about a place into features a model can use.
OPEN GLOSSARY CARD
Nowcasting
Estimating a current condition before delayed official measurements are available.
OPEN GLOSSARY CARD
Weighted Interval Score
A forecasting metric that rewards accurate probability ranges and penalizes intervals that miss the outcome or are unnecessarily wide.
SOURCES AND VERIFICATION STATUS
This article was written from the materials below. Product claims and dates were checked against those sources on October 7, 2026.
THE PUBLICATION ENGINE
WANT A SIGNAL OF YOUR OWN?
We build source-grounded publications, private briefings, and editorial systems for organizations with something useful to say.
WORK WITH US